Litecoin price started a strong rally above $90.00 and $100.00 against the US Dollar. LTC is consolidating gains and it could rally further above $110.00.
- Litecoin started a strong surge above the $90.00 and $100.00 resistance levels against the US Dollar.
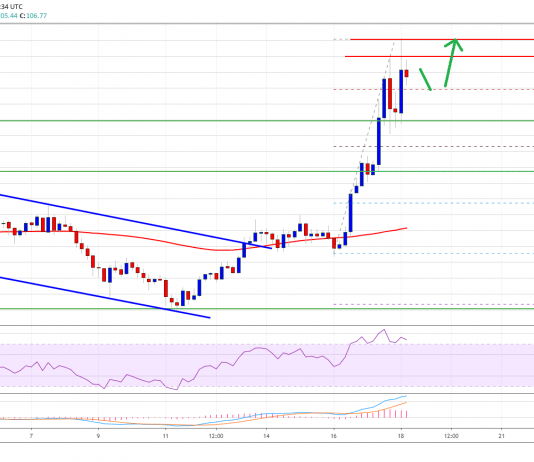
- The price tested the $110.00 resistance zone and it settled above the 100 simple moving average (4-hours).
- There was a break above a crucial declining channel with resistance at $80.00 on the 4-hours chart of the LTC/USD pair (data feed from Kraken).
- The price traded as high as $112.76 before it started consolidating gains.
Litecoin Price Rallies 20%
In the past 2-3 days, there was a strong increase in bitcoin, Ethereum, ripple and litecoin against the US Dollar. LTC price formed a major support base near the $72.00 level before starting a fresh increase.
To start the recent rally, there was a break above a crucial declining channel with resistance at $80.00 on the 4-hours chart of the LTC/USD pair. The pair broke the $90.00 and $100.00 resistance levels. There was also a close above the $100.00 level and the 100 simple moving average (4-hours).
It even spiked above the $110.00 level and a new monthly high was formed near $112.76. The price is currently consolidating gains above the $100.00 level.
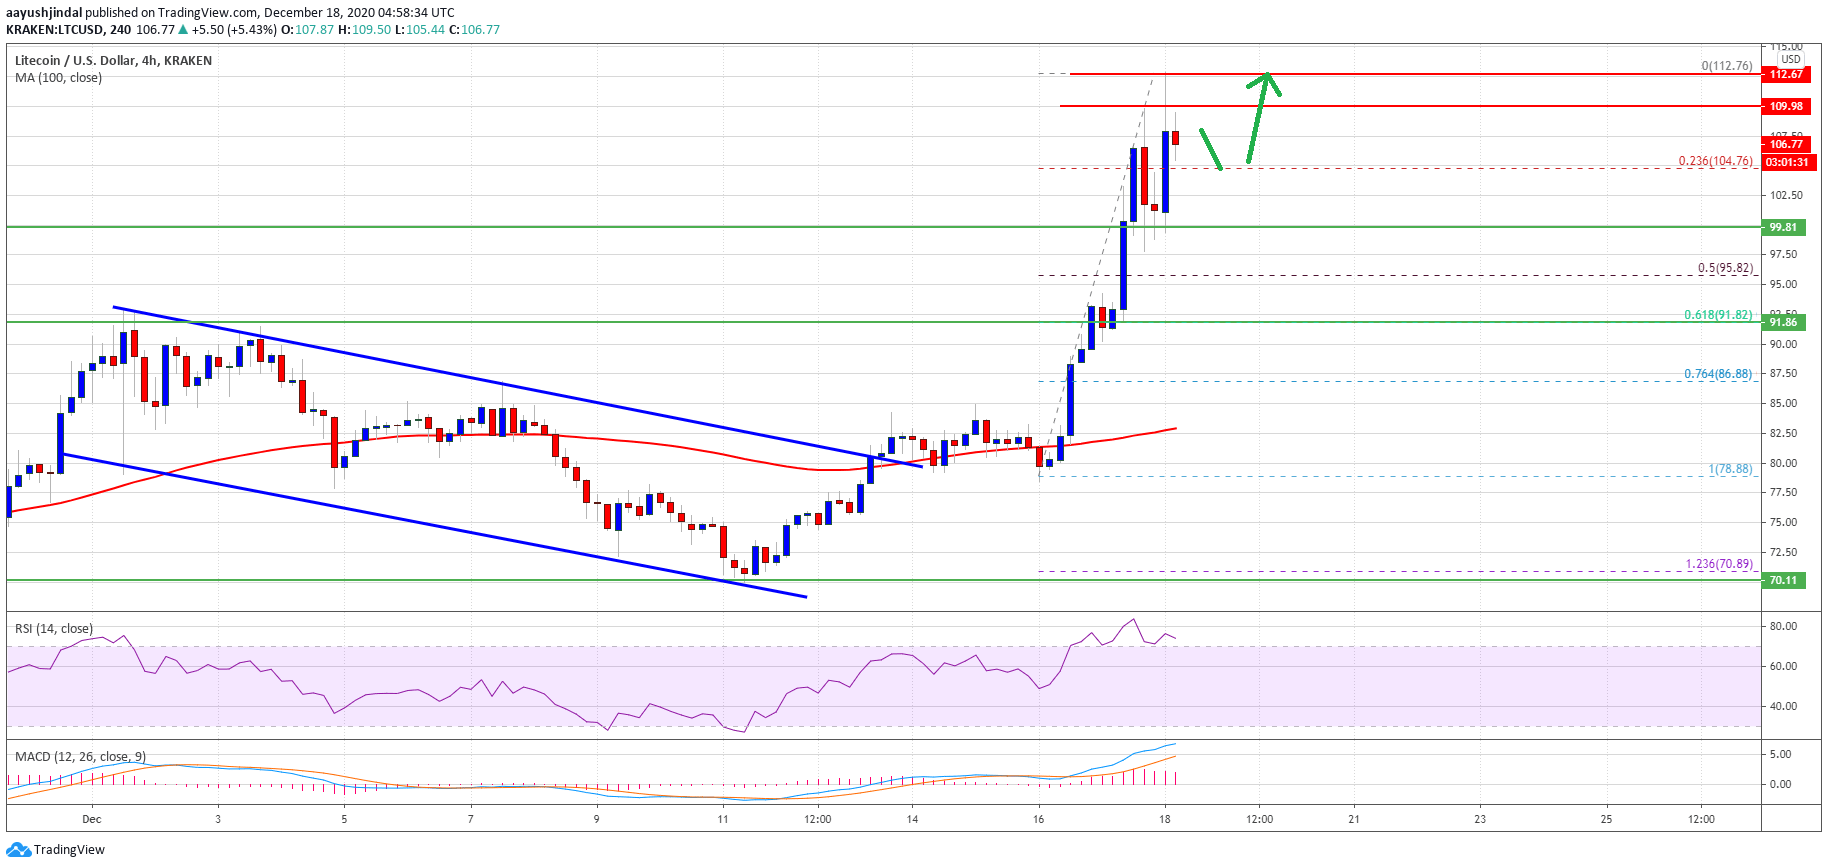
Source: LTCUSD on TradingView.com
There was a minor dip below the $105.00 level. The price even traded below the 23.6% Fib retracement level of the upward move from the $78.88 swing low to $112.76 high. However, the price is finding a strong support near the $100.00 level.
The next major support is near the $95.00 zone. It is close to the 50% Fib retracement level of the upward move from the $78.88 swing low to $112.76 high. On the upside, the $110.00 level is a key hurdle. A close above the $110.00 level may possibly set the pace for a move towards the $125.00 and $130.00 levels.
Dips Supported in LTC?
There could be limited downsides in litecoin below the $100.00 level. The first major support is forming near the $95.00 level.
Any further losses may perhaps send the price towards the $90.00 support in the coming sessions. The next major support is near the $92.00 zone.
Technical indicators:
4-hours MACD – The MACD is slowly losing momentum in the bullish zone.
4-hours RSI (Relative Strength Index) – The RSI for LTC/USD is currently correcting lower from the oversold zone.
Major Support Levels – $100.00 followed by $95.00.
Major Resistance Levels – $110.00 and $125.00.
The post Charted: Litecoin Settles Above $100, Why LTC Could Rally Further Above $110 appeared first on Crypto Scoop News.
The post Charted: Litecoin Settles Above $100, Why LTC Could Rally Further Above $110 appeared first on GQ Central.